Jul 07, 2020
In a series of blog posts we will focus on some of the best practices we use within Merapar to evolve our DevOps practices we have built around the AWS platform. Why? Because we think it’s fun to share knowledge and to learn from others in the industry.
Situation
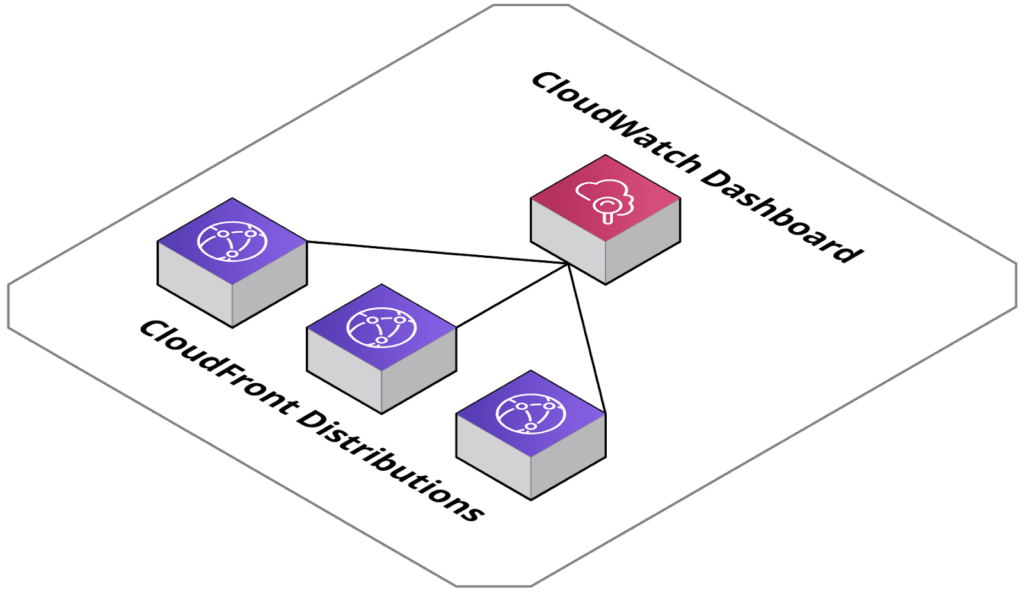
In this blog post we will focus on how we set up monitoring using a single AWS CloudWatch dashboard for a project where we have multiple AWS CloudFront Distributions.

The metrics that need to be monitored will be the same for all of the Distributions as the type of traffic is very similar. As the number of Distributions will change often we need a flexible solution to prevent repetitive tasks of adding / removing references to the Distribution in our CloudFormation templates. We also have a strong need to have the same code base between all our DTAP environments.
Requirements:
- Creation of AWS CloudWatch dashboard must be fully automated
- Multiple CloudFront Distributions within a single dashboard
- No code changes required on CloudFormation dashboard to add new Distributions
Solution
The solution we have chosen uses a CloudFormation template and the macro functionality to perform the required transformations to the template.
What are CloudFormation macros
CloudFormation macros are simply AWS Lambda functions that you create and can be used to transform your input CloudFormation template. This gives you the ability to do search and replace operations or to transform the template completely.
Macros are run after uploading the template and before applying it. It is possible to see both the input and the processed template within the AWS CloudFormation console to make it easier to debug.
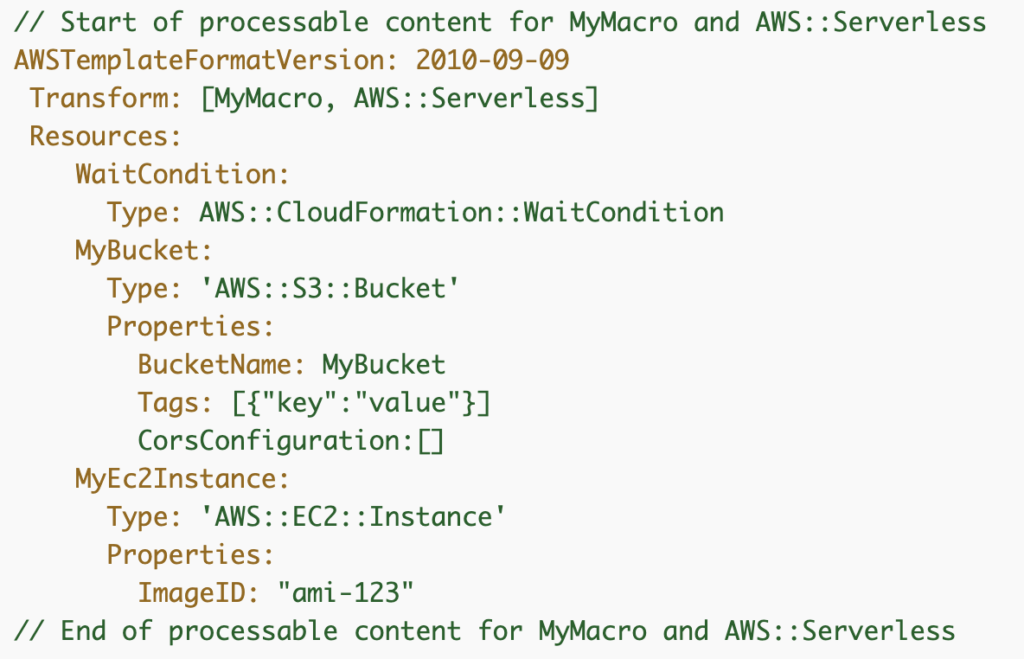
It is possible to have a macro process the complete template using the Transform section

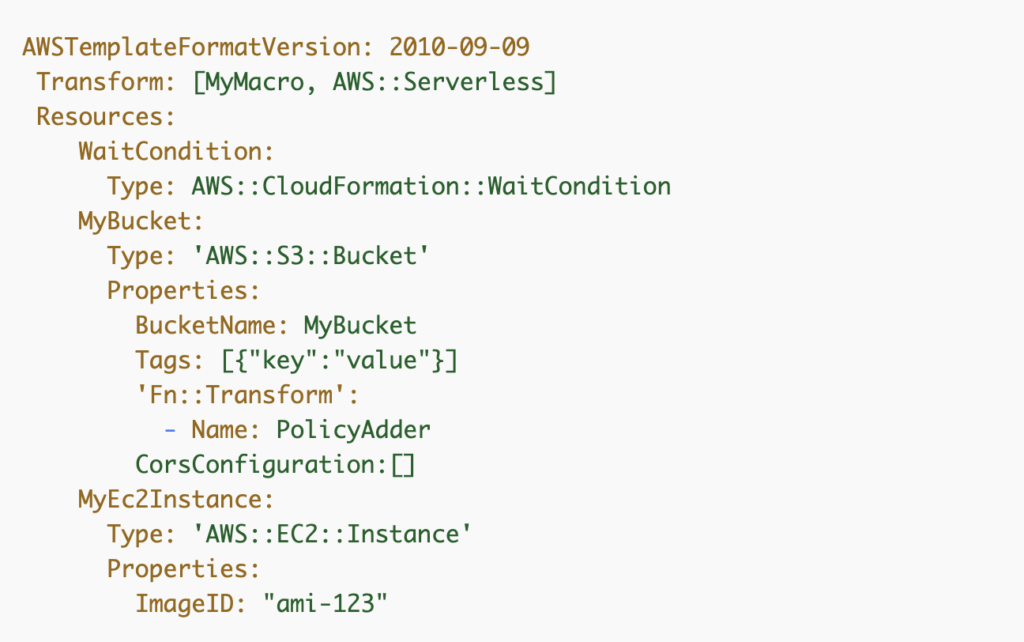
Or to limit the scope to a smaller part of the template using Fn::Transform

For more specific information about AWS CloudFormation macros take a look at this user guide from AWS.
CloudFormation template
For our solution we have chosen to use the smaller scoped solution and we created to following template:
AWSTemplateFormatVersion: "2010-09-09"
Description: 'AWS CloudFront dashboard'
Parameters:
  DistributionConfiguration:
    Type: String
    Description: "JSON object like: [ { \"distributionId\" : \"A1234\", \"domain\" : \"cloudfront.example.com\"},
                { \"distributionId\" : \"A4123\", \"domain\" : \"secondcloudfront.example.com\"}
              ]"
Resources:
  CloudFrontDashboard:
    Type: AWS::CloudWatch::Dashboard
    Fn::Transform:
        Name: ExpandDashboard
        Parameters:
          Distribution: !Ref DistributionConfiguration
    Properties:
      DashboardName: "CloudFrontDashboard"
      # The region here is fixed, since the metrics are stored in us-east-1.
   DashboardBody: !Sub
        - |
          {
            "widgets": [
                {
                    "type": "metric",
                    "x": 12,
                    "y": 0,
                    "width": 12,
                    "height": 6,
                    "properties": {
                        "metrics": ###5XXERRORRATE###,
                        "view": "timeSeries",
                        "stacked": false,
                        "region": "${AWS::Region}",
                        "title": "Per distribution 5xx error rates %",
                        "stat": "Maximum",
                        "period": 300
                    }
                },
                {
                    "type": "metric",
                    "x": 12,
                    "y": 6,
                    "width": 12,
                    "height": 6,
                    "properties": {
                        "metrics": ###4XXERRORRATE###,
                        "view": "timeSeries",
                        "stacked": false,
                        "region": "${AWS::Region}",
                        "title": "Per distribution 4xx error rate %",
                        "stat": "Maximum",
                        "period": 300
                    }
                },
                {
                    "type": "metric",
                    "x": 0,
                    "y": 0,
                    "width": 12,
                    "height": 6,
                    "properties": {
                        "metrics": ###REQUESTS###,
                        "view": "timeSeries",
                        "stacked": false,
                        "region": "${AWS::Region}",
                        "stat": "Sum",
                        "period": 300,
                        "title": "Per distribution request count (Sum)"
                    }
                }
           }
The Fn::Transform is used to scope just the dashboard and the Distribution variable is passed to the transform. We have used the ###xxx### markers to easily find and replace the values we need to transform.
In our setup there is a deployment script that will first deploy all required CloudFront Distributions based on a configuration file and once completed, it will deploy the dashboard with that same list. This list of Distributions is passed as the DistributionConfiguration parameter with a JSON object as input for this template.
Macro Lambda code
The ExpandDashboard macro is a Python3 AWS Lambda that is deployed separately from the CloudFront Distributions and the CloudWatch dashboard.
import json
import traceback
import dataclasses
@dataclasses.dataclass
class CloudFrontMetric:
    kind: str
    distribution_id: str
    label: str
    index: int
    def getMetric(self):
        return [
                "AWS/CloudFront", self.kind,
                "Region", "Global",
                "DistributionId", self.distribution_id,
                {
                    "region": "us-east-1", #us-east-1 because of CloudFront
                    "yAxis": "right",
                    "id": f"m{self.index}",
                    "visible": False,
                    "label": self.label
                }
            ]
def replaceMarker(original, marker, json_input):
    return original.replace(marker, json.dumps(json_input).replace("\"", "\\\""))
def handler(event, _):
    print(event)
    region = event["region"]
    # Add the visible normalized values
    fivexx_error_rate = [ [{ "expression": "FILL(METRICS(), 0)", "label": "[avg: ${!AVG}]", "id": "e1", "region": region } ]]
    fourxx_error_rate = [ [{ "expression": "FILL(METRICS(), 0)", "label": "[avg: ${!AVG}]", "id": "e1", "region": region }]]
    requests = [[{ "expression": "FILL(METRICS(), 0)", "label": "[avg: ${!AVG}]", "id": "e1", "region": region } ]]
    # Add the invisible raw metrics for each distribution
    distributions = json.loads(event["params"].get('Distribution'))
    index = 0
    while index < len(distributions):
        distribution = distributions[index]
        print(distribution)
        distribution_id = distribution.get('distributionId')
        domain = distribution.get('domain')
        if distribution_id and domain:
            fivexx_error_rate.append(CloudFrontMetric("5xxErrorRate", distribution_id, domain, index).getMetric())
            fourxx_error_rate.append(CloudFrontMetric("4xxErrorRate", distribution_id, domain, index).getMetric())
            requests.append(CloudFrontMetric("Requests", distribution_id, domain, index).getMetric())
        index += 1
    final_fragment = event["fragment"]
    # First convert the input to text, this makes it easier to do replacements.
    jsonText = json.dumps(final_fragment)
    print(jsonText)
    # Replace
    jsonText = replaceMarker(jsonText, "###5XXERRORRATE###", fivexx_error_rate)
    jsonText = replaceMarker(jsonText, "###4XXERRORRATE###", fourxx_error_rate)
    jsonText = replaceMarker(jsonText, "###REQUESTS###", requests)
    print(jsonText)
    # Convert back to JSON
    final_fragment = json.loads(jsonText)
    response = {
        "requestId": event["requestId"],
        "status": "success",
        "fragment": final_fragment
    }
    return response
This Lambda function will loop through the input JSON object and add the configuration required for the 4xx, 5xx errors and request widgets for all distributions.
Dashboard
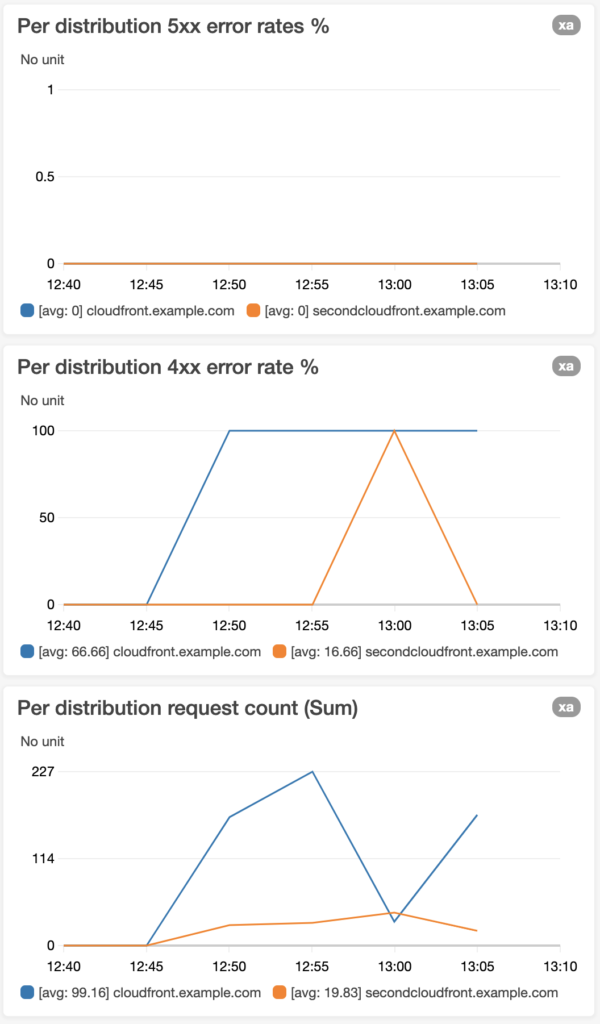
This is what the dashboard will look like:
